CitizenHelper: A Streaming Analytics System to Mine Citizen and Web Data
for Humanitarian Organizations
A. SYSTEM ARCHITECTURE AND ANALYTICAL FEATURES

(Figure 7.) System Architecture
System Component Details
Data Collection - Data Sources and Apache Kafka Framework:
CitizenHelper uses an opensource distributed computing platform to collect data (see
Figure 7), which provides flexibility to scale producers (information sources), and
consumers
(information processors), in addition to a streaming data buffer---valuable for slow
downstream processors when needed. The system currently supports real-time data
collection using
Streaming and Location APIs of Twitter, as well as Instagram and Facebook (for public
groups
and pages), which are useful during humanitarian disasters for situational awareness
information collection. Additionally, the system supports the collection of news
(including
GDELT) and blogs streams as well as data from Web knowledge bases including Wikipedia,
and
OpenGov Data.
Metadata Processing - Spark Streaming, Application Web Server, and Analytics
Services:
The proposed system connects data collection components from to processors in opensource
stream computing framework Apache Spark. Different processors perform analytics on the
streamed content by leveraging various analytics services, to extract and associate
enriched
metadata such as information provider classification (e.g., gender, user type such as
organization), content classification for topics, intent, etc.
Data Storage and Visual Dashboard:
CitizenHelper stores raw data in a file system for long-term archiving, and processed
data
with extracted metadata in a database that supports a frontend visualization dashboard
Kibana for streaming analytics. Our visual dashboard is composed of different analytical
widgets, such as volume trend graphs of Twitter posts (tweets) over time. %top active
users with a tweet frequency corresponding to a topical hashtag, and so on. These
widgets have two
unique features. First, when a user interacts with a widget and modifies an analysis
unit on
the widget (e.g., time slice on a trend graph, the region of interest on the map,
topical tag in
the word cloud list), then all analytical widgets get updated corresponding to that
change
in the analysis unit. Second, the visual dashboard supports collaborative teamwork by
allowing saving and sharing of a state of the dashboard by an end-user, which in turn
allows
another collaborating team member studies the same set of analyses from his/her
colleague.
Also, these widgets can be repositioned and deleted as needed to avoid visual
information overload. System details with exemplary analyses and demos are available at
the demo link,
based on prior interactions with the analysis widgets.
Usage
Explore each widget by interacting with that for fine-grained analysis of an event or a
topic,
such as selecting the timeline for a specific period will render all other widgets
accordingly.
Widgets include:
- Volume Timeline: shows Volume trend for engagement in this topic. Select a
timeline
slice
to
analyze, by mouse over selection.
- Activity Timeline: shows top Twitter users over time who engaged in this
topic.
- Tweet Cloud: shows tweet summaries for analyzing public concerns and
reactions
for
this
event, by
user types.
- User Cloud: shows user profile summaries for analyzing the participating
demographics
in
discussions of this topic, by user types (e.g., organization).
- Activity Tile Map: shows participation of users across geographical
locations.
Select
a
location
for constraining analysis in other widgets.
- Open Data Map: shows displacement data statistics across the world, to inform
comparative
analysis of user engagement in the concerned locations.
- Tweet Stream: shows specific set of tweets with frequency for the selected
constraints of
analysis.
- User Graph: shows user engagement frequency, to identify actively engaged
users.
Future Analytics: user type (gender, user affiliations with organizations), emotion
with
concerned
topics, organization network analysis, etc.
B. ANALYSIS EXAMPLES FOR HUMANITARIAN ORGANIZATIONS
1. Demographics - Content Practices of Specific User Identities for
Gender-Violence
Events

|

|
| (Figure 8.a.) Organizations tweet
about
husbands |
(Figure 8.b.) Tweets by individual
users
describing
themselves as husbands |
Figure 8. Husband Portrayal: Individual identity user accounts who identify themselves
as husbands in user profiles write pro-women tweet content, whereas when Organization
identity user accounts describe Husbands they are portrayed as threats. This data was
collected for the domain of anti-gender-based violence over the period of Aug 4th, 2016
to Aug 28th, 2016.
2. Narratives of Diverse Sources - Analysis for Gender-Violence Events

|

|
| (Figure 9.a.) Editorial-news
Content Summary
|
(Figure 9.b.) User-generated
Content Summary
|
Figure 9. Our tool allows us to compare the topics related to our research that are
currently
being
covered by the world news vs those that people are talking about on Twitter. In this
figure,
we
observed the diverse nature of narratives being promoted on news media, in contrast to
diverse
types
of issues being carried over under the activism for anti-gender violence, during the
period
of
Aug
4th 2016 to Aug 28th, 2016.
3. Temporal Diffusion - Analysis for Gender - Topic activity over time for
Gender-Violence
Events

|

|
| (Figure 10.a.) Tweets by Topic
|
(Figure 10.b.) Tweets over time
|
Figure 10 - Our tool allows us to view the breakdown of topics in the current stream of
tweets
for
a
specific domain. In this figure, we observe the trend of the number of tweets by topic
vs the
total
number tweets for the domain anti-gender based violence over the period of July 31st,
2016
to
September 1st, 2016.
4. Geographical Engagement - Awareness Analysis for Gender-Violence Events
 |
 |
| (Figure 11.a.) Tweet count by
location
|
(Figure 11.b.) Gender based
violence
counts
provided by
open data from FBI UCR |
Figure 11. The visual tool allows us to view tweets by originating location, which
indicates
the
user
participation and awareness of concerning issues. In this figure, we observe the
variation in
number
of tweets indicating social awareness by location from Aug 4th, 2016 to Aug
28th
2016, and the contrasting pattern of
2014 GBV related reports by location in the FBI Uniform Crime Record
data.
 |
 |
|
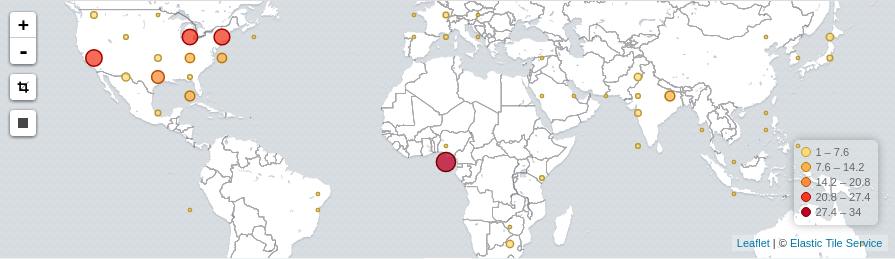
(Figure 12.a.) Tweet count by location
|
(Figure 12.b.) Global Displacement counts provided by open data from IDP
|
Figure 12. The geographical contrast analysis capability for another humanitarian issue
of
Global
Displacement. In this figure, we observe the variation in the number of tweets
originating
by
location -- indicating social awareness and reporting for the issue -- during the period
of
Jan
5th,
2017 to Feb 23rd, 2017, and in contrast to the reported displacement by IDP.
5. Hashtag analysis - #likeagirl
- #likeagirl - Women are portrayed in a positive light using this hashtag, and
both
individuals and organizations have endorsed it. It is likely because of pro-women
start
for
this
movement by an organization - Tag cloud of hashtags shows the endorsements of other
communities
and related initiatives in this movement.
-
Reference
about #LikeAGirl 1
-
Reference
about #LikeAGirl 2

|

|
| (Figure 13.a.) Hashtags Mentioned
by Individuals |
(Figure 13.b.) Hashtags Mentioned
by Organizations |
Related Articles and Publications
-
Prakruthi Karuna, Mohammad Rana, and Hemant Purohit. (2017). CitizenHelper: A
Streaming
Analytics System to Mine Citizen and Web Data for Humanitarian Organizations. In The
11th
International AAAI Conference on Web and Social Media
(ICWSM-17).
[pdf - author version]
- Stabile, B., Grant, A., Purohit, H., & Rama, M. (2019). “She Lied”: Social
construction, rape myth
prevalence in social media, and sexual assault policy. Sexuality, Gender & Policy,
2(2), 80-96.
(SGP).
[pdf - author
version]